H+T® Index
The Housing and Transportation (H+T®) Affordability Index provides a comprehensive view of affordability that includes both the cost of housing and the cost of transportation at the neighborhood level.
H+T Index Learn MoreThe Housing and Transportation (H+T®) Affordability Index provides a comprehensive view of affordability that includes both the cost of housing and the cost of transportation at the neighborhood level.
H+T Index Learn MoreThe Index is part of a broader effort to explore urban sustainability through location efficiency.
 H+T Index
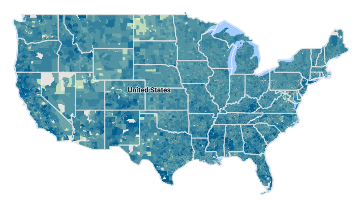
See how affordability in nearly 220,000 neighborhoods is impacted when the traditional measure of affordability is expanded to include transportation costs. By taking into account the combined costs of housing and transportation associated with the location of the home, the H+T Index provides a more complete understanding of affordability.
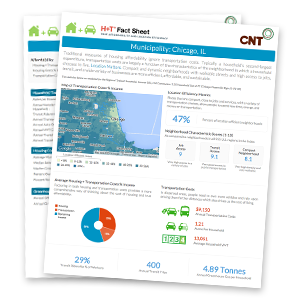 H+T Fact Sheets
H+T Fact Sheets include maps, charts, key indicators and data for your community.
Quickly create customized H+T Fact Sheets with multiple metrics for municipalities, counties, CBSAs, MPOs, and U.S. Congressional Districts.
H+T Index information has implications for consumers, planners, and policy makers. Learn how the data is being used across the country.
Applications for Use
CNT works across disciplines and issues, including transportation and community development, energy, water, and climate change. Learn more about CNT and its programs at CNT.org.
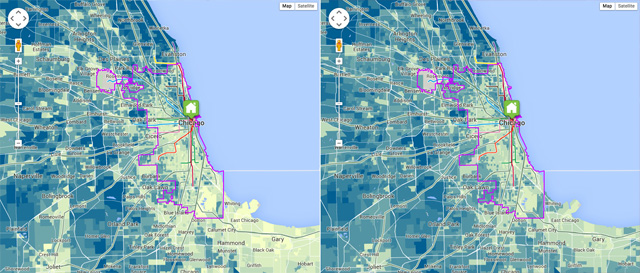
Transportation costs vary between and within regions, and this directly affects living expenses. Comparing the traditional measure of housing affordability to one that includes the cost of transportation provides a more comprehensive view of the affordability of a neighborhood, city, or region.
View Comparison Map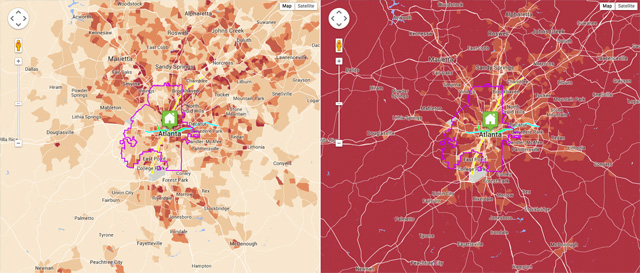
At first glance, cities may appear to be a big source of the greenhouse gases (GHGs) that contribute to global climate change. However, driving-related emissions for households living in location-efficient urban neighborhoods can be up to half of what they are for households in the least-efficient, car-dependent neighborhoods.
View Comparison Map