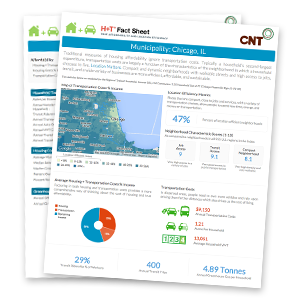
Nationwide Housing + Transportation Statistics
Traditional measures of housing affordability ignore transportation costs. Typically a household’s second-largest expenditure, transportation costs are largely a function of the characteristics of the neighborhood in which a household chooses to live. Location Matters. Compact and dynamic neighborhoods with walkable streets and high access to jobs, transit, and a wide variety of businesses are more efficient, affordable, and sustainable.
The statistics below are modeled for the Regional Typical Household. Income: Commuters: Household Size: ()
Map of Transportation Costs % Income

- < 8%
- 8-12%
- 12-15%
- 15-18%
- 18-22%
- 22-26%
- 26-29%
- 29% +
Location Efficiency Metrics
Places that are compact, close to jobs and services, with a variety of transportation choices, allow people to spend less time, energy, and money on transportation.
Neighborhood Characteristic Scores (1-10)
As compared to neighborhoods in all 955 U.S. regions in the Index
JobAccess
AllTransitPerformance Score
CompactNeighborhood
Average Housing + Transportation Costs % Income
Factoring in both housing and transportation costs provides a more comprehensive way of thinking about the cost of housing and true affordability.
Transportation Costs
In dispersed areas, people need to own more vehicles and rely upon driving them farther distances which also drives up the cost of living.
Annual Transportation Costs
Autos Per Household
Average Household VMT
Transit Ridership % of Workers
Annual Transit Trips
Annual Greenhouse Gas per Household


H+T Metrics
Affordability
Demographics
Household Transportation Model Outputs
Housing Costs
Greenhouse Gas from Household Auto Use
Environmental Characteristics
© Copyright, Center for Neighborhood Technology


